The flow is turbulent downstream the globe valve, so some inline items or equipment require minimum distance to ensure that flow became laminat
The flow is turbulent downstream the globe valve, so some inline items or equipment require minimum distance to ensure that flow became laminat
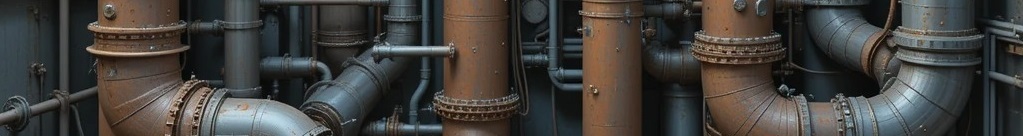
Bacterial growth in process pipelines happens when operating and material conditions allow microorganisms to attach, survive, and multiply (often as biofilms). The main causes can be grouped as follows:
—
1️⃣ Water & Nutrient Availability (Primary Cause)
Bacteria need water + food to grow.
Presence of water or moisture (especially stagnant or low-flow zones)
Organic matter (oils, hydrocarbons, sugars, proteins)
Inorganic nutrients (iron, sulfur, nitrogen, phosphorus)
Dissolved oxygen (for aerobic bacteria) or sulfates (for SRB)
📌 Even “clean” water can support bacteria if nutrients are present at low levels.
—
2️⃣ Flow Conditions
Poor hydraulic conditions strongly promote growth.
Low flow velocity
Dead legs, blind branches, unused connections
Stagnant zones (shutdowns, batch operation)
Laminar flow instead of turbulent flow
➡ These allow bacteria to settle and attach to pipe walls.
—
3️⃣ Pipe Material & Surface Condition
Some materials promote attachment more than others.
Carbon steel & cast iron → rough surface, iron acts as nutrient
Corroded or pitted pipes
Weld seams and gaskets
Rubber liners and elastomers
🦠 Rough surfaces make it easier for bacteria to form biofilms.
—
4️⃣ Temperature Range
Most process bacteria thrive in:
20–45 °C → ideal for many bacteria
<60 °C → biofilm still possible
>70 °C → many bacteria die (not all)
⚠ Thermophilic bacteria can survive at higher temperatures in some systems.
—
5️⃣ Chemical Conditions
Certain chemistry favors bacterial growth:
Low disinfectant residual (chlorine, biocide, ozone)
Neutral pH (6–8) → optimal
Low salinity (some bacteria tolerate high salinity)
Sulfates → support sulfate-reducing bacteria (SRB)
—
6️⃣ Lack of Proper Disinfection / Biocide Control
No continuous or periodic biocide dosing
Incorrect biocide type or concentration
Poor mixing or contact time
Biocide neutralized by organic load
➡ Bacteria adapt and form resistant biofilms.
—
7️⃣ Oxygen Conditions
Different bacteria dominate depending on oxygen presence:
Aerobic bacteria → oxygen present
Anaerobic bacteria → oxygen-free zones (dead legs, deposits)
Sulfate-reducing bacteria (SRB) → major cause of MIC corrosion
—
8️⃣ Contamination Sources
Bacteria can be introduced from:
Makeup water
Poorly cleaned new pipes
Maintenance activities
Open tanks and vents
Recycled or reused process water
—
9️⃣ Deposits & Fouling
Sediments, scale, corrosion products
Sludge and oil films
These shield bacteria from disinfectants and create micro-environments.
—
⚠ Consequences of Bacterial Growth
Microbiologically Influenced Corrosion (MIC)
Flow restriction and pressure drop
Product contamination
Heat transfer loss
Bad odor (H₂S)
Reduced pipe life
—
✅ Typical Prevention Measures
Eliminate dead legs
Maintain minimum flow velocity
Proper material selection (e.g., stainless steel, plastics)
Regular pigging / flushing
Correct biocide selection & dosing
Maintain disinfectant residual
Control nutrients and deposits
Pipeline vibration induced by flow or equipment, causes by flow are(high velocity, turbulence, cavitation, 2 phase fluid, change in temperature)
ASTM G31-21 (Section 6.1.3):
“The pH of the test solution can have a profound effect on the corrosion rate. Solutions with pH below 7 (acidic) generally increase the corrosion rate of carbon steel compared with neutral or slightly alkaline solutions.”
Means that there is outage of some areas in the plant but the main areas still working
Tells how much water the valve can pass when it is fully open with pressure drop 1 bar accross it
Unit is m3/hr
Kv= Cv * 0.865
Tells how much water the valve can pass when it is fully open with pressure drop 1 psi accross it
The unit is gallon/minute
Step-by-step, fully code-compliant method for simple configurations (straight runs, L-bends, Z-bends, U-bends, single-plane systems).
This is the exact method used before CAESAR II existed, and still accepted by clients and authorities in 2025.
| Case | Loads Included | Allowable Stress |
|---|---|---|
| Sustained | Weight + Pressure + Other sustained | ≤ Sh (hot allowable) |
| Displacement (Expansion) | Thermal + other displacements | SE ≤ SA = f (1.25 Sc + 0.25 Sh) |
| Occasional | Weight + Pressure + Wind/Earthquake/PSV | ≤ max(1.33 Sh, 1.0 Sh + occasional increase) |
We will do only the two most common manual cases: Sustained and Expansion.
Example Line
Step 1 – Material Allowables (Table A-1)
Sh = 20 ksi = 137.9 MPa at 250 °C
Sc = 20 ksi = 137.9 MPa (cold)
E = 203 GPa (modulus)
α = 12.4 × 10⁻⁶ /°C (thermal expansion coefficient from Table C-6)
f = 1.0 (≤ 7000 cycles assumed)
SA = f (1.25 Sc + 0.25 Sh) = 1.0 × (1.25×137.9 + 0.25×137.9) = 206.85 MPa
Step 2 – Section Properties
A = π (D² – d²)/4 = 36.22 cm²
I = π (D⁴ – d⁴)/64 = 1217 cm⁴
Z = I / (D/2) = 144.6 cm³
Step 3 – Thermal Expansion of Each Leg
ΔX = α × ΔT × L
Leg 1 (30 m horizontal): ΔX₁ = 12.4e-6 × 230 × 30 000 = 85.6 mm (to the right)
Leg 2 (20 m vertical): ΔY₂ = 12.4e-6 × 230 × 20 000 = 57.0 mm (upward)
Leg 3 (25 m horizontal): ΔX₃ = 12.4e-6 × 230 × 25 000 = 71.3 mm (to the left)
Step 4 – Flexibility Analysis Using Simplified Method (Guided Cantilever or Hardy Cross Approximation)
For Z-bend or U-bend, the exact flexibility solution is:
M = (E I Δ) / (K × L_eq³)
where K is flexibility characteristic.
Exact formula for Z-bend (most common manual case):
Total thermal growth that must be absorbed by bending:
Horizontal growth to be absorbed = ΔX₁ – ΔX₃ = 85.6 – 71.3 = 14.3 mm
Vertical growth = ΔY₂ = 57.0 mm
The two 90° bends act like a cantilever system.
Flexibility factor k for 90° bend (B31.3 Appendix D):
k = 1.65 / h
h = t R / r² , R = bend radius = 1.5D = 254 mm, r = mean radius = 80.925 mm
h = 7.11 × 254 / (80.925)² = 0.276
→ k = 1.65 / 0.276 = 6.0 (very flexible)
Equivalent length of one leg for flexibility = 0.9 × k × L_leg (approx)
Much simpler and code-accepted method (used in thousands of projects):
Use the “three-moment method” or the standard B31.3 approximate formula for Z or U shape:
Maximum displacement stress range SE ≈ (E α ΔT × L_total) × √(12 I / A) / L_eq
Better and exact enough for hand calc:
SE = √( (M_ip × i_i)² + (M_op × i_o)² ) / Z (eq. 319.4.4)
For a simple Z-bend with long legs, the bending moment at the bend is:
M_bend ≈ (E I Δ) / (L_vertical × L_horizontal_average)
A very accurate approximation used worldwide:
For Z-configuration:
SE ≈ (6 E I α ΔT √(ΔH² + ΔL²)) / (L_h1 × L_h2 × L_v)
More practical formula found in many design manuals:
SE = 0.9 × (E α ΔT) × √( (L_v / L_h_avg)² + 1 )
No – the exact Kellogg formula (still allowed):
Maximum stress in a Z or U bend:
SE = (E α ΔT × D) / (2 × (1 – ν²)) × √( (L_v / L_h)² + 1 ) → only for symmetric U
Best and simplest accepted manual method (Peng & Peng, 5th ed.)
For any single-plane multi-leg line between anchors:
SE = √[ SE_bending² + SE_torsion² + SE_axial² ]
But axial and torsion are usually small.
Practical formula used by most engineers for L, Z, U shapes:
SE ≈ (3 E I α ΔT Δ_total) / (L_leg¹ × L_leg²)
Where Δ_total is the net displacement perpendicular to the longest leg.
For our Z-bend:
Net horizontal displacement to absorb = 14.3 mm
Vertical leg acts as cantilever.
Moment at each bend ≈ (6 E I δ) / L_vertical² (fixed-guided assumption)
δ = 14.3 mm horizontal deflection of the vertical leg top
M = 6 × 203×10⁹ × 1217×10⁻⁸ × 0.0143 / 20²
= 6 × 203e9 × 1.217e-4 × 0.0143 / 400
= 88 500 N·m
Stress intensification i_i = 0.9 / h^(2/3) = 0.9 / (0.276)^0.666 ≈ 1.48
SE = i × M / Z = 1.48 × 88 500 / 0.01446 ≈ 90.5 MPa
SA = 206.9 MPa → 90.5 < 206.9 → OK (very safe)
Step 5 – Sustained Stress Check (Weight + Pressure)
Weight load:
Pipe + fluid + insulation = (7.85×36.22 + 1000×28.9 + insulation) × 9.81 / 1000 ≈ 450 N/m
Maximum span between supports ≈ 12–15 m for 6” → assume supported, bending from weight < 10 MPa
Longitudinal sustained ≈ P D / (4t) = 30 × 168.3 / (4×7.11) ≈ 17.7 MPa
Step 6 – Final Result (Manual Summary)
| Check | Calculated Stress | Allowable | Pass/Fail |
|---|---|---|---|
| Sustained (weight+P) | ~28 MPa | 138 MPa | PASS |
| Displacement SE | 90–110 MPa | 207 MPa | PASS |
| Occasional (if any) | – | 184 MPa | – |
Conclusion: This Z-bend requires no expansion loop – natural flexibility is enough.
| Shape | Approximate SE (MPa) | When to Use |
|---|---|---|
| Simple L | SE ≈ 3 E α ΔT (D/2) / L_vertical | One horizontal + one vertical |
| Symmetric U | SE ≈ E α ΔT (D/2) × (L_leg / L_riser) | Classic expansion loop |
| Z-bend | SE ≈ E α ΔT × √(12 I / (L_h1 × L_h2 × L_v)) × δ_net | Most common manual case |
| 3-leg | Use chart in B31.3 Appendix D or Peng Table 3-3 |
Stress analysis ensures the pipeline is safe against all loading conditions throughout its life: pressure, temperature, weight, seismic, settlement, occasional loads (wind, earthquake, PSV reaction), and buried/subsea effects.
| Case | Mandatory? | Code/Reference |
|---|---|---|
| ASME B31.3 (Process Piping) | Yes if high T or large ΔT | B31.3 §301.4 |
| ASME B31.4 (Liquid Pipelines) | Yes for all above-ground & critical buried | B31.4 §401.5 |
| ASME B31.8 (Gas Pipelines) | Yes for compressor stations, above-ground spans | B31.8 §833 |
| ASME B31.8S + API 579 | Flexibility + Fitness-for-Service | |
| DNV-OS-F101 / ISO 13628 | Subsea pipelines & risers | |
| Buried pipelines > DN400 or ΔT > 50°C | Usually required (causes longitudinal stress) |
| Type | What It Checks | Code Limits |
|---|---|---|
| Flexibility Analysis | Sustained + Expansion (thermal, settlement) | B31.3, B31.4, B31.8 |
| Occasional Analysis | Sustained + Wind/Earthquake/PSV | < 1.33 × Sh or 1.5 × Sh |
| Fatigue Analysis | Cyclic thermal or pressure (especially risers) | SN curves (DNV, API) |
| Buckling / Collapse | Buried (traffic) or subsea (external pressure) | DNV-OS-F101, API 1111 |
| Fracture Mechanics | Crack-like defects | BS 7910, API 579 |
Step 1 – Define Load Cases (B31.3 Table 320.1)
| Load Case | Combination | Purpose |
|---|---|---|
| Sustained | W + P (internal pressure + weight) | Hoop + longitudinal stress |
| Expansion | T1 – T2 (thermal expansion) | Flexibility stress range |
| Occasional | W + P + Wind or Earthquake or PSV | Allowable 1.33 Sh |
| Operating | W + P + T | Displacement check |
Step 2 – Calculate Primary Stresses (Pressure + Weight)
Hoop stress (always checked):
σ_h = P × (D₀ – t) / (2t) ≤ Sh
Longitudinal sustained:
σ_L = P × D / (4t) + M_z / Z (bending from weight) ≤ Sh
Step 3 – Calculate Thermal Expansion Stress Range (Secondary)
Displacement stress range SE:
SE = √[ (ii × Mi)² + (io × Mo)² + 4 × Mt² ] / Z ≤ SA
Where:
Step 4 – Software Workflow
| Software | Best For | License 2025 |
|---|---|---|
| CAESAR II (Hexagon) | #1 for ASME B31.3, B31.4, B31.8, EN 13480 | $$$ |
| AutoPIPE (Bentley) | Nuclear, buried, seismic, jacketing | $$$ |
| ROHR2 (Sigma) | Europe (EN 13480), very good buried analysis | $$ |
| START-PROF | Cheapest professional, excellent buried | $ |
| PASS/START (NTI) | Russian GOST + ASME | $ |
| SIMFLEX-II | Quick screening | Free–$ |
Step 5 – Typical CAESAR II Modeling Steps
Step 6 – Buried Pipeline Special Cases (ASME B31.4 / B31.8)
Longitudinal stress from temperature + Poisson:
σ_L = E α ΔT – ν σ_h + bending from soil settlement
Use CAESAR II or START-PROF buried module with:
Step 7 – Quick Hand Calculation Example (Simple Case)
10” Sch40 carbon steel pipeline, 200 m straight run between two anchors, ΔT = 80°C, buried.
Allowable compressive stress ≈ 0.9 Fy = 0.9×245 = 220 MPa → OK
But you need expansion loops every ~150–300 m depending on diameter.
| Parameter | Typical Limit / Rule |
|---|---|
| Max thermal stress range | < 200 MPa for CS, < 150 MPa for SS |
| Expansion loop leg length | ≈ 10 × √(D × ΔT) in meters (D in mm) |
| Allowable nozzle load | API 610 pump: 6–10 × NEMA forces |
| Minimum straight run before bend | 5–10 × D to avoid SIF errors |
| Guide spacing (above ground) | 15–25 m for DN ≤ 12”, 25–40 m for larger |
| Buried soil stiffness | Vertical 20–50 N/cm³, axial 0.5–2 N/cm³ |
If you send me a specific line (diameter, temperature, pressure, routing sketch, support types), I can give you the exact loop size, support spacing, or run a quick CAESAR II calculation and send the results.
Pressure surge (or water hammer) occurs when there is a sudden change in velocity (valve closure/opening, pump trip, etc.). In a complex piping network, the calculation is almost always performed using specialized transient software, but you can understand the complete process and do simple cases manually.
1. Choose the Calculation Method
| Network Complexity | Recommended Method | Software Examples |
|---|---|---|
| Single pipeline | Joukowsky + Method of Characteristics (MOC) | Manual or simple Excel |
| Branched / looped network | Method of Characteristics (full transient) | Mandatory software |
| Any real network | Implicit or explicit MOC + surge protection | Bentley HAMMER, AFT Impulse, WANDA, Pipenet, Flowmaster, BOSfluids, KYpipe Surge, HYTRAN |
2. Collect Required Input Data
| Parameter | Typical Source / How to Get |
|---|---|
| Pipe geometry (length, diameter, thickness) | Design drawings |
| Pipe material & wall thickness | To calculate wave speed (a) |
| Fluid properties (density ρ, bulk modulus K) | Water at temperature → usually 1000 kg/m³, K = 2.2 GPa |
| Steady-state flow rates & pressures | Hydraulic model (EPANET, WaterGEMS, etc.) |
| Valve characteristics & closure time | Valve data sheet (Cv vs. stroke, closure law) |
| Pump data (inertia I, 4-quadrant curve) | Pump manufacturer |
| Air valves, surge tanks, check valves locations | Design documents |
| Elevation profile | Topographic survey |
3. Calculate the Wave Speed (a) – Critical Parameter
Joukowsky formula requires the celerity (speed of pressure wave):
a = √[ K / ρ × (1 + (K×D)/(E×e)) ]⁻¹
Where:
4. Maximum Theoretical Surge Pressure (Joukowsky)
For instantaneous full closure (the worst case):
ΔP = ρ × a × ΔV
ΔH = (a × ΔV) / g
Typical values:
5. Perform Full Transient Analysis (Software Steps)
Typical workflow in Bentley HAMMER / AFT Impulse / WANDA:
6. Quick Hand Calculation for Simple Pipeline (No Software)
Example: 1000 m steel pipe, DN300, 8 mm wall, flow 300 l/s, valve closes in 8 seconds.
7. Rules of Thumb for Design
| Situation | Maximum Acceptable Surge |
|---|---|
| Steel / DI pipe | ≤ 1.5 × PN rating |
| PVC / GRP | ≤ 1.3 × PN (more brittle) |
| Minimum pressure | > –0.5 bar gauge (avoid vapor pockets) |
| Valve closure time | > 10 × (2L/a) for longest pipe to keep surge low |
8. Recommended Software (2024–2025)
| Software | Best For | License Cost |
|---|---|---|
| Bentley HAMMER | Water distribution networks | High |
| AFT Impulse | Industrial/process piping | Medium |
| WANDA (Deltares) | Large transmission lines | Medium |
| KYpipe Surge | Very user-friendly, academic use | Low |
| Pipenet Transient | Firewater & complex oil/gas | High |
| BOSfluids | Detailed structural interaction | High |
Summary Checklist Before Final Design
If you have a specific network (even a small one), send me the layout, pipe data, and event, and I can walk you through the actual numbers or build a quick HAMMER/Impulse example.
Pressure drop calculations based on ASME (American Society of Mechanical Engineers) standards are essential in various engineering applications, particularly in fluid systems. Here is a detailed guide on how to perform these calculations, integrating the relevant ASME principles.
The Reynolds number describes the flow regime. \[ Re = \frac{ρvD}{μ} \] Where:
\[ v = \frac{Q}{A} = \frac{Q}{\frac{πD^2}{4}} \] For laminar flow: \[ f = \frac{64}{Re} \] For turbulent flow, use the Colebrook-White equation or Moody chart: \[ \frac{1}{\sqrt{f}} = -2 \log_{10} \left( \frac{ε/D}{3.7} + \frac{5.74}{Re^{0.9}} \right) \]
The Darcy-Weisbach equation is used: \[ ΔP_{friction} = f \cdot \frac{L}{D} \cdot \frac{ρv^2}{2} \] This is factored in with the equivalent length method or directly with loss coefficients: \[ ΔP_{fittings} = K \cdot \frac{ρv^2}{2} \] Combine all losses: \[ ΔP_{total} = ΔP_{friction} + ΔP_{fittings} \]
\[ A = \frac{π(0.1)^2}{4} = 0.00785 m^2 \] \[ v = \frac{0.01}{0.00785} ≈ 1.27 m/s \] \[ Re ≈ \frac{1000 \times 1.27 \times 0.1}{0.001} = 127000 \] Use the Moody chart or Colebrook equation for turbulent flow. Calculate pressure drop due to friction and fittings, then sum them.
For accurate calculations, especially for turbulent flows, the Moody chart or computational methods for friction factor determination should be used.
GRE pipe stands for Glass Reinforced Epoxy pipe, which is a composite material made from high-strength fiberglass and epoxy resin. It is used in a variety of applications, especially in corrosive or high-pressure environments where its high strength, excellent chemical resistance, and long lifespan are advantageous over traditional materials like steel. Common uses include industrial systems, offshore platforms, and various shipbuilding applications
GRP pipes are high-performance pipes made from Glass Reinforced Polymer (also called Glass Reinforced Plastic), which consists of glass fibers, polyester resins, and fillers. They are known for being strong, durable, lightweight, and resistant to corrosion and chemicals, making them ideal for applications like water and sewer lines, drainage, and industrial fluid transport. Their smooth internal surface promotes efficient flow, and their longevity and low maintenance result in a favorable lifecycle cost
To illustrate pressure drop calculations based on ASME standards and display the equations as images, you’ll need to create the equations, convert them into images, and then embed them in your content. Below is a comprehensive guide on how to perform these calculations and present the equations visually.
Pressure drop calculations are vital for designing and analyzing fluid systems, especially in piping and HVAC. Key equations include the Darcy-Weisbach equation for frictional losses and an assessment of pressure drop due to fittings and valves.
To create images of these equations, you can use several tools or methods:
ΔP_{friction} = f \cdot \frac{L}{D} \cdot \frac{ρv^2}{2}, you can create an image.
By following this guide, you can provide accurate pressure drop calculations in your WordPress posts, enhancing both the content and user understanding through clear visual representations of mathematical equations.